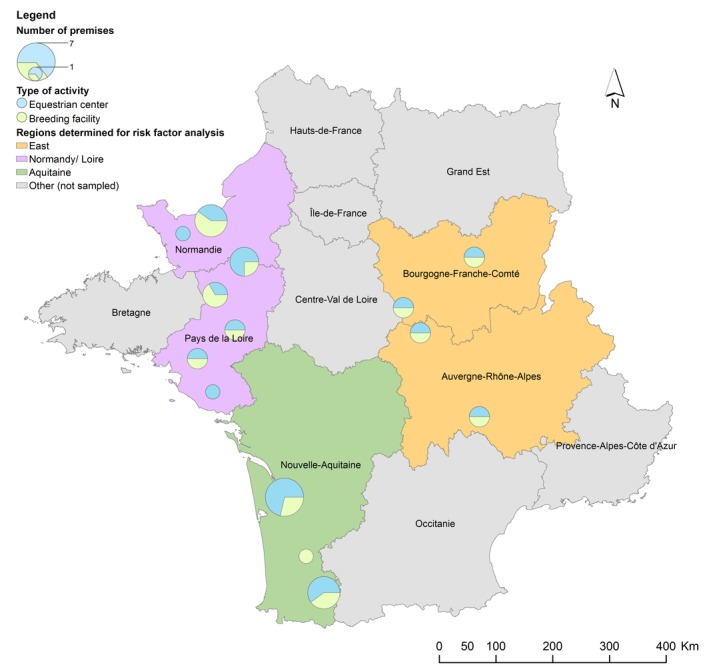
Figure 1.

Geographical distribution of sampled premises over the French territory in a cross‐sectional study of 132 healthy adult horses, in 41 premises, performed in 2015. Colored regions were defined for the risk factor calculation. The size of the circle is proportional to the number of premises sampled
