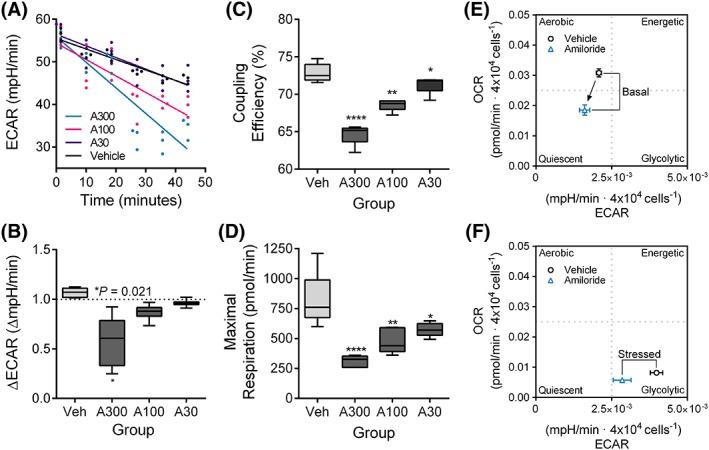
Figure 7.

Combined energy phenotype analysis reveals a dose‐dependent effect of amiloride on ECAR and OCR in D17 cells. (A) Linear regression model of ECAR during the first 50 minutes, representing readings after amiloride injection. (B) Fold changes in ECAR expressed across all treatment groups tested after amiloride injection. Coupling efficiency (C) and maximal respiration (D) as measured using the mitochondrial stress test. (E‐F) Energy phenotype analysis after a 24‐hour pretreatment with amiloride (100 μM). ECAR and OCR were normalized to cell density (4 x 10⁻⁴ cells), and vehicle‐treated cells were compared to amiloride‐treated cells after oligomycin injection. A metabolic switch is indicated by the black arrow between the phenotype markers. Median ± range values were presented in box plots. Mean ± SD values were presented in energy phenograms. Significance was recorded at *P < .05, **P < .01, ****P < .0001. ECAR, extracellular acidification rates; OCR, oxygen consumption rates
