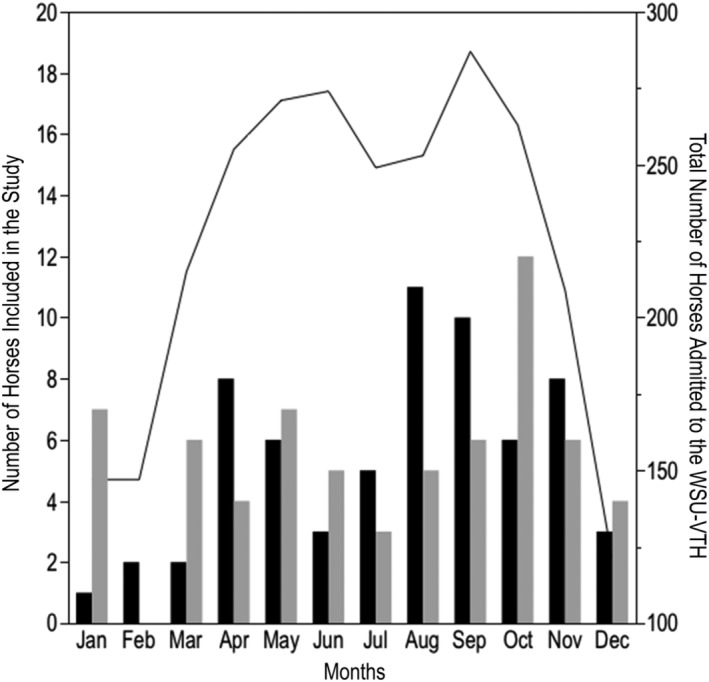
Figure 1.

Monthly distribution of the total number of horses admitted to the VTH‐WSU (solid line, right y‐axis) and the number of horses included in the study (bars, left y‐axis) in the Gastrointestinal Disease group (black bars) and in the Anesthesia group (gray bar)
