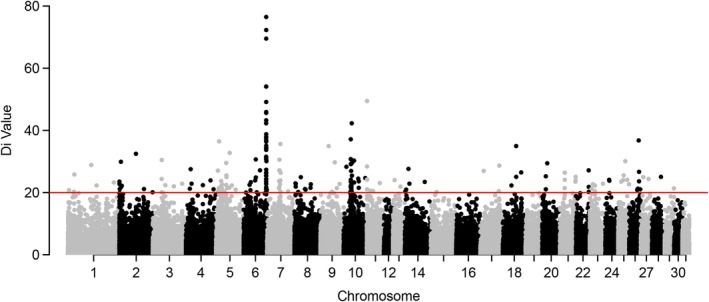
Figure 1.

Genome‐wide di values for Welsh ponies. Each d i value is plotted on the y‐axis and each autosome is shown on the x‐axis in alternating colors. Each dot represents a 10 kb window. The red horizontal line represents the top 0.1% of the empirical distribution of d i values. One region of interest on equine chromosome 6 (ECA6) spanned ~782 kb segment, ranging from 81 003 617 to 81 785 414 bp
