
Figure 2.
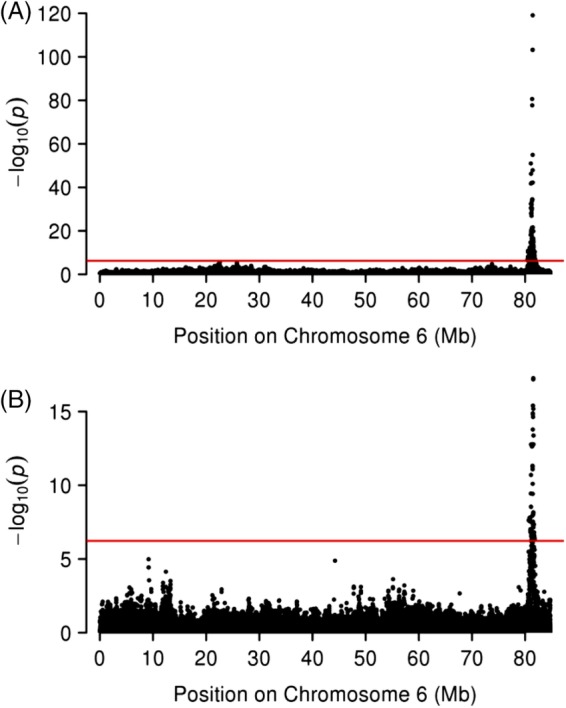
Plot of the association analysis for equine chromosome 6 (ECA6) in 264 Welsh Ponies (WP). The base pair positions for chromosome 6 are plotted along the x‐axis and the −log10 of the P‐values are plotted on the y‐axis. Individual circles represent single nucleotide polymorphisms (SNPs). The red line marks the thresholds for genome‐wide significance. (A) Results obtained in WP for height. Significant associations were noted on ECA6 with SNPs between 80 501 273 and 81 808 008 bp. (B) Results obtained in WP for baseline insulin. Significant associations were noted on ECA6 with SNPs between 80 639 787 and 81 651 604 bp