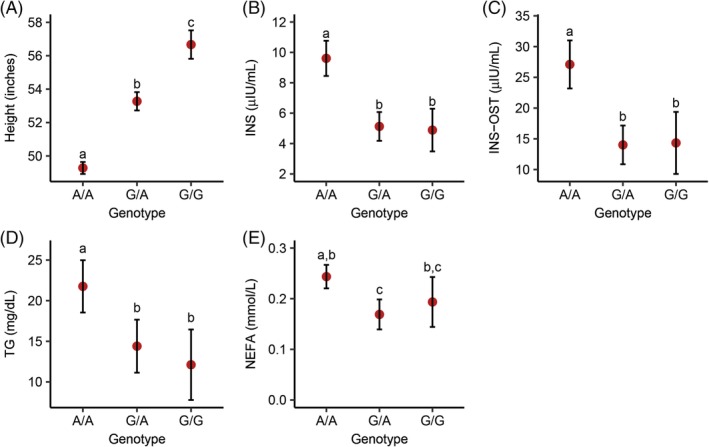
Figure 4.

Least‐square mean estimates and 95% confidence intervals for the HMGA2 c.83G>A variant and various phenotypes in a population of 294 Welsh ponies. Height (A), insulin (B), insulin after an oral sugar test (INS‐OST) (C), triglycerides (D), and non‐esterified fatty acids (NEFA) (E)
