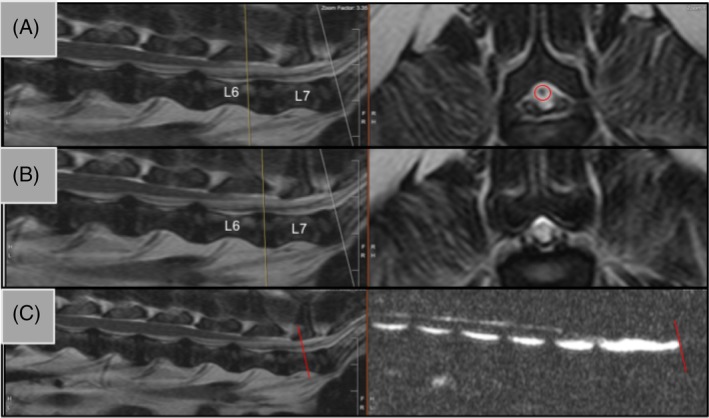
Figure 1.

Identification of A‐B, spinal cord termination and C, dural sac termination. Panels A and B show representative T2‐sagittal views (left) and transverse views (right). The yellow line is a reference line showing the corresponding location of the transverse slice. In panel A, the hypointense signal representing the spinal cord is still present and is seen within the red circle at L6. Panel B shows the next transverse slice where the spinal cord signal has disappeared at L6/L7 disc space. Dural sac termination is shown in C with a T2‐weighted sagittal view and a half‐Fourier acquisition single‐shot turbo spin echo (HASTE) sequence side‐by‐side. The red line indicates HASTE termination and the triangulation tool was used to identify the same location on the T2‐weighted sagittal view
