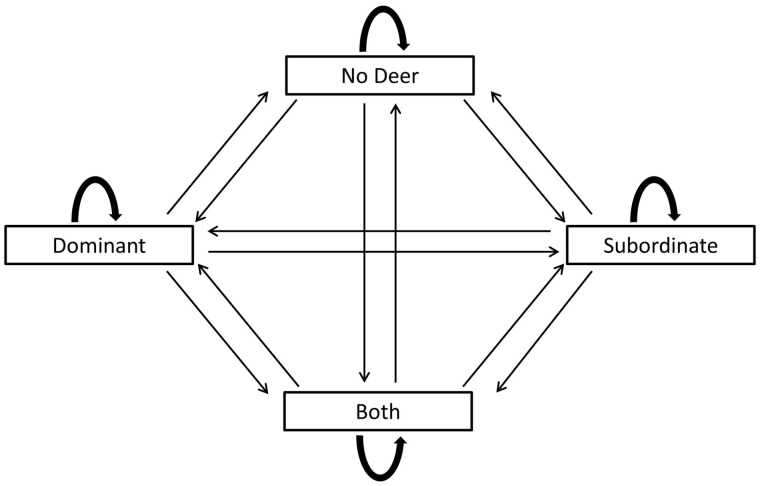
Figure 1.
Transition diagram for multistate model used to estimate probability of feeding sites transitioning from one state to another state, or the probability of the feeding site staying in the same state. There were 4 possible states (States 1–4) that a feeding site could be in during any given hour. State 1 = no deer present; State 2 = subordinate (adult females and yearling males) present; State 3 = dominant (adult males) present; State 4 = subordinate and a dominant present.

