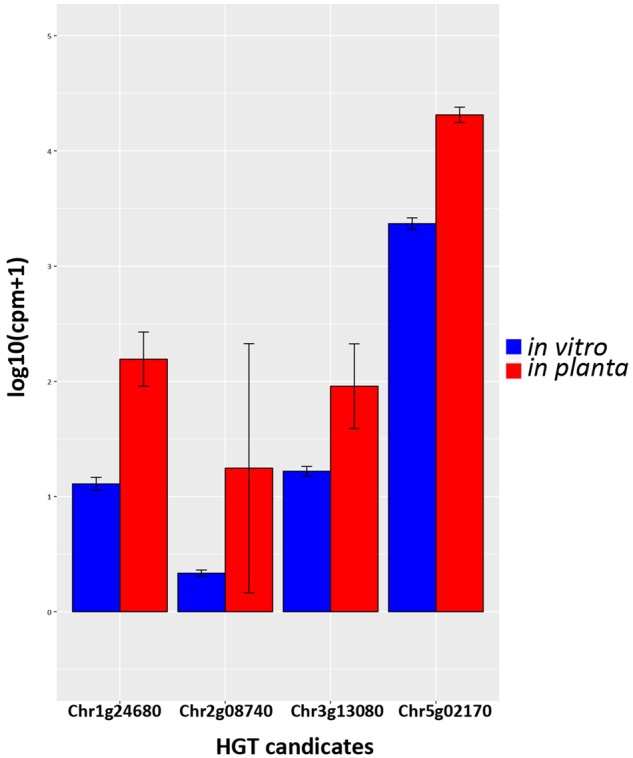
Fig. 8.

—Pair-wise comparison of HGT candidates with differential expression in vitro and in planta. Gene expressions are depicted for Verticillium dahliae strain JR2 cultured in liquid medium and upon Arabidopsis thaliana colonization, respectively. Bars represent the mean gene expression with standard deviations. The significance of difference in gene expression was calculated using t-tests relative to a threshold (TREAT) of log 2-fold-change ≥1 (McCarthy and Smyth 2009).
