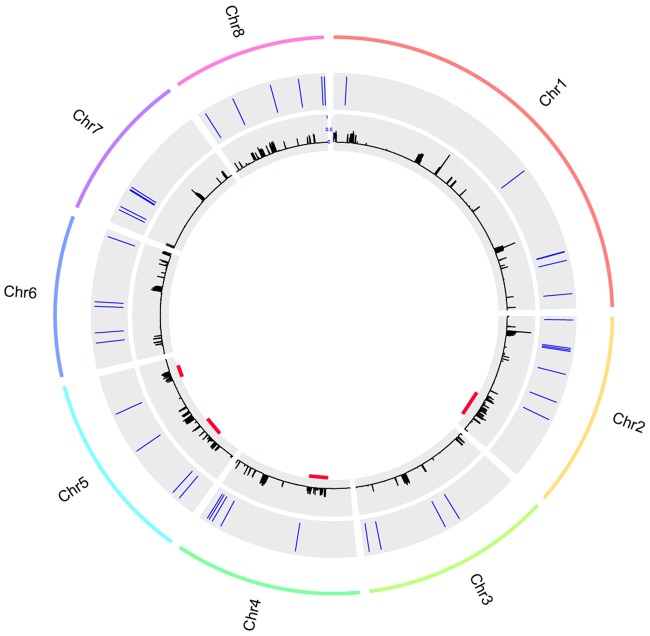
Fig. 9.
—Genomic location of the HGT candidates. The outer lane represents the chromosomes of Verticillium dahliae strain JR2. The middle lane shows the relative position of the HGT candidates in each chromosome. The inner lane shows the repeat density. The red lines indicate the locations of the LS regions (Depotter et al. 2018).

