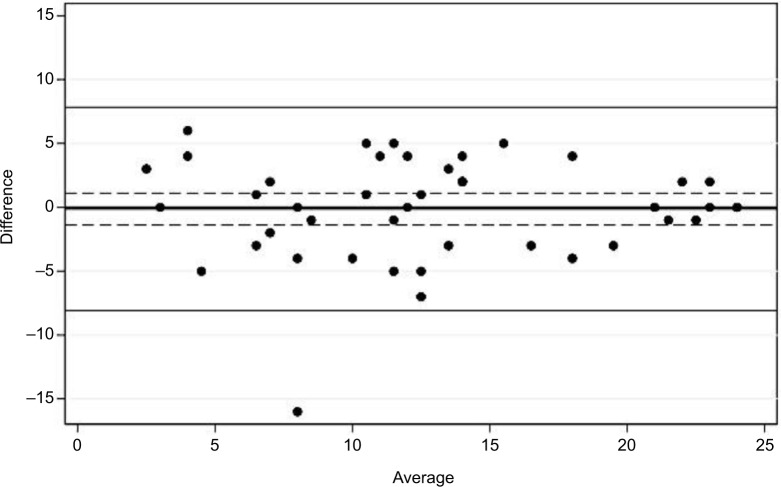
Figure 1.
Bland–Altman plot.
Notes: Intraindividual differences between the Fear-Avoidance Belief Questionnaire for physical activity (FABQ-PA) scores on test and retest plotted against the average of scores. The center line represents the mean difference with 95% CI (dashed lines), and the solid flanking lines represent the 95% limits of agreement.

