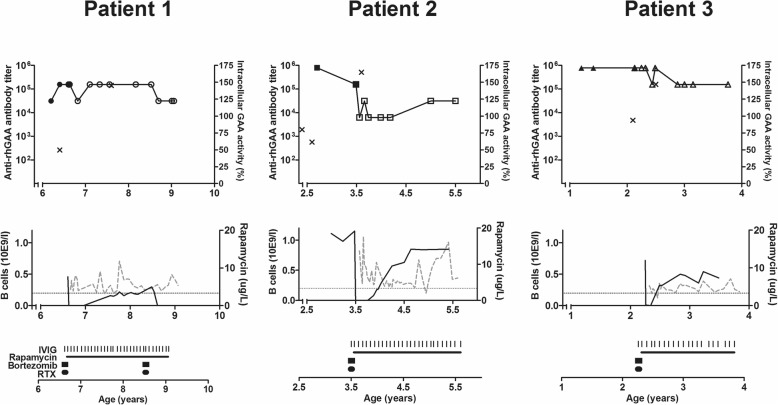
Fig. 2.
Effects of immunomodulation. Each column represents a single patient. Upper row: Anti-rhGAA antibody titer in detail after immunomodulation, as shown previously in Fig. 1 (line with symbols on the left axis), and neutralizing effects of anti-rhGAA antibodies (crosses, on the right axis). Middle row: Serum B-cell levels per patient (black line on the left axis) and Rapamycin serum levels per patient (grey dashed line on the right axis). Dotted grey line represents the lower level of normal for B cells for age, which is 0.2*10E9/l. Bottom row: Immunomodulation treatment per patient. Verticals stripes represent each individual IVIG infusion. Horizontal lines represent the period in which Rapamycin taken. Squares represent each cycle of 6 Bortezomib infusions. Circles represent each cycle of 3 Rituximab infusions

