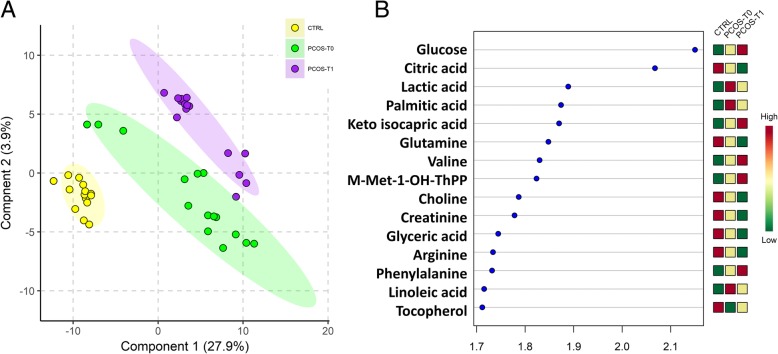
Fig. 1.
a Partial least square discriminant analysis (PLS-DA) models to discriminate Controls (CTRL, yellow circles), PCOS patients at enrolment (PCOS-T0, green circles) and PCOS patients after 3-months treatment (PCOS-T1, purple circles). The explained variance of each component is shown in parentheses on the corresponding axis. b The 15 top-scoring VIP metabolites (VIP-score ≥ 1.5) are shown. The colored boxes on the right indicate the relative amount of the corresponding metabolite in each group under study

