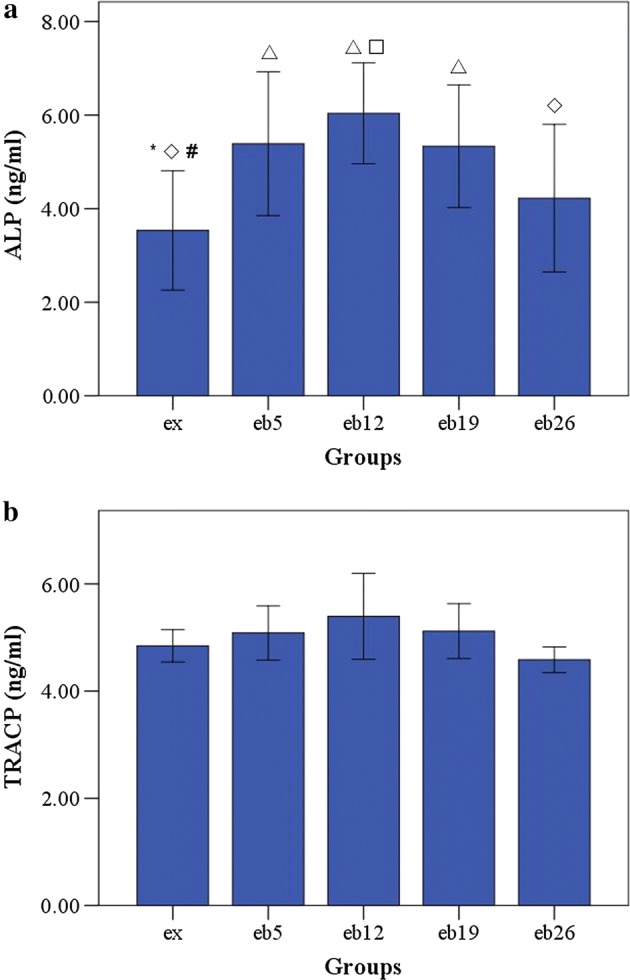
Fig. 7.

The serum concentrations of ALP and TRACP in each group. Error bars represent SD. △Statistically different from the ex group (p < 0.05); *Statistically different from the eb5 group (p < 0.05); ◇Statistically different from the eb12 group (p < 0.05); #Statistically different from the eb19 group (p < 0.05); □Statistically different from the eb26 group (p < 0.05). a ALP concentration. b TRACP concentration
