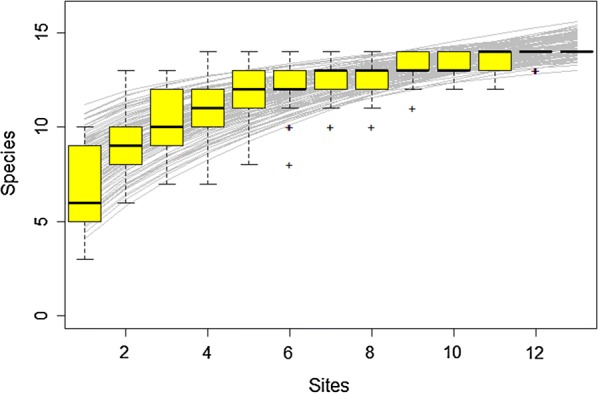
Fig. 2.

Species accumulation curve for the species observed in Mayotte. Boxplots mark standard deviations, crosses represent outlier points and grey curves represent the different simulations of richness indexes (Chao, Chao bias-corrected, first order jackknife, second order jackknife and bootstrap estimators)
