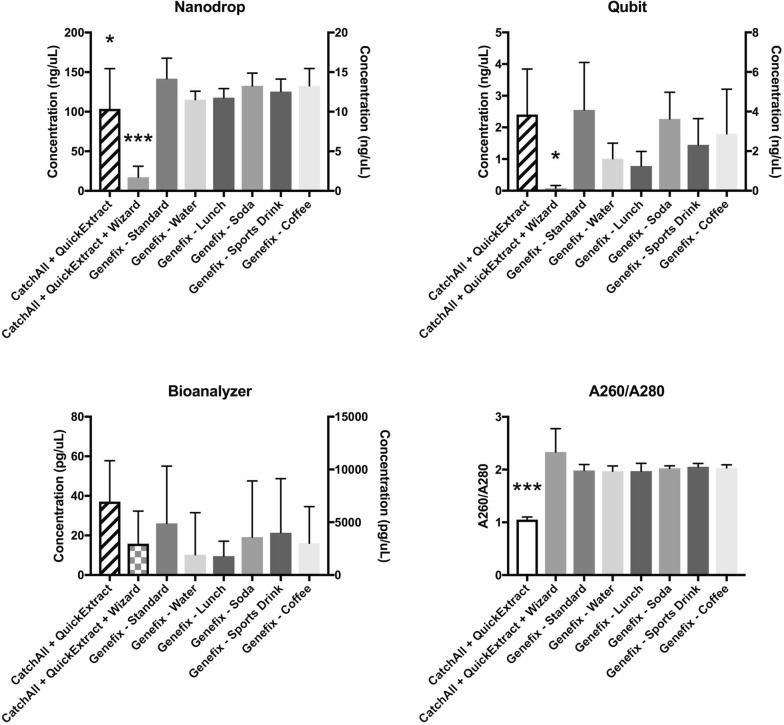
Fig. 1.
Sample concentrations by three different methods of quantification (Nanodrop, Qubit, and Bioanalyzer) and a purity assessment by the ratio of absorbance at 260 and 280 nm. “CatchAll” conditions are the two swab collections and “Genefix” are the six spit collections. Swab sample concentrations are plotted on the left y-axis while spit sample concentrations are plotted on the right y-axis. Two axes were used as the swab sample without secondary purification (CatchAll + QuickExtract) contains contaminants that absorb at 260 nm in the Nanodrop. *p < 0.05, ***p < 0.001

