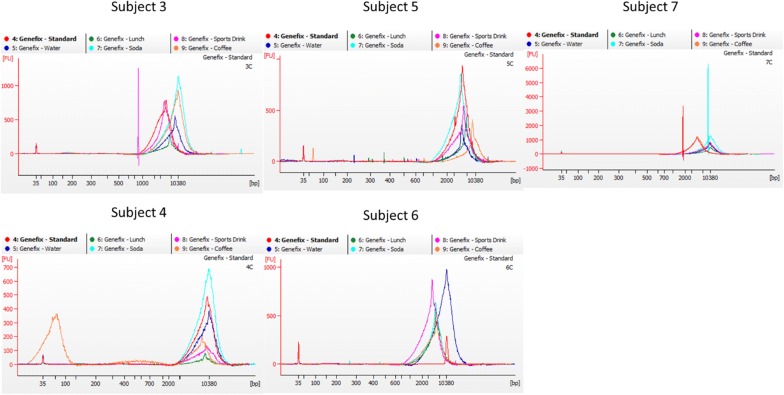
Fig. 2.
Bioanalyzer electropherogram traces of the spit samples. Each subject is shown individually with colors representing collection conditions: following manufacturer’s instructions (red), after consuming water (blue), after eating lunch (green), after consuming a carbonated beverage (cyan), after consuming a sports drink (magenta), and after consuming coffee (orange)

