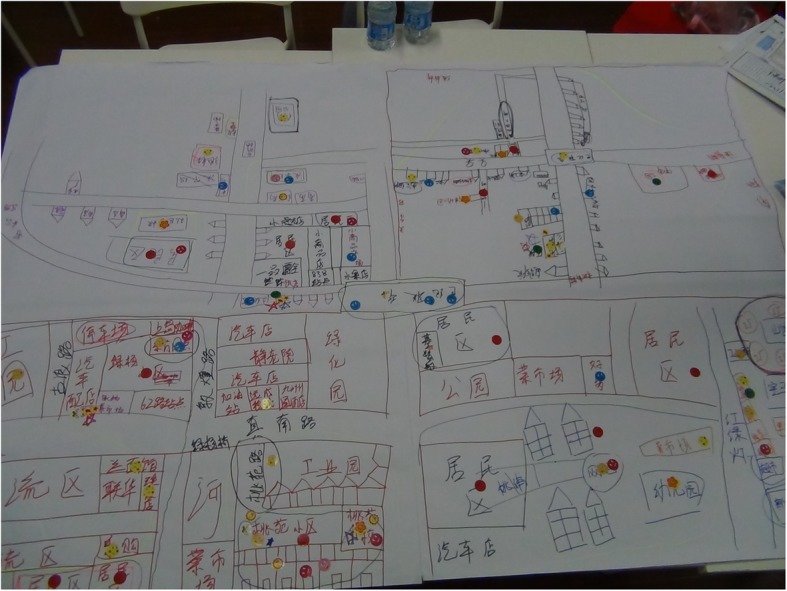
Fig. 3.

A community map indicating migrants’ living environments and accessible facilities. The places where internal migrants live concentratedly were drawn on the lower left part of the paper, meaning migrants’ living places were in the fringe area of the community. (Drawn by internal migrant youth of CMG activity, female, 18–19 years old group.)
