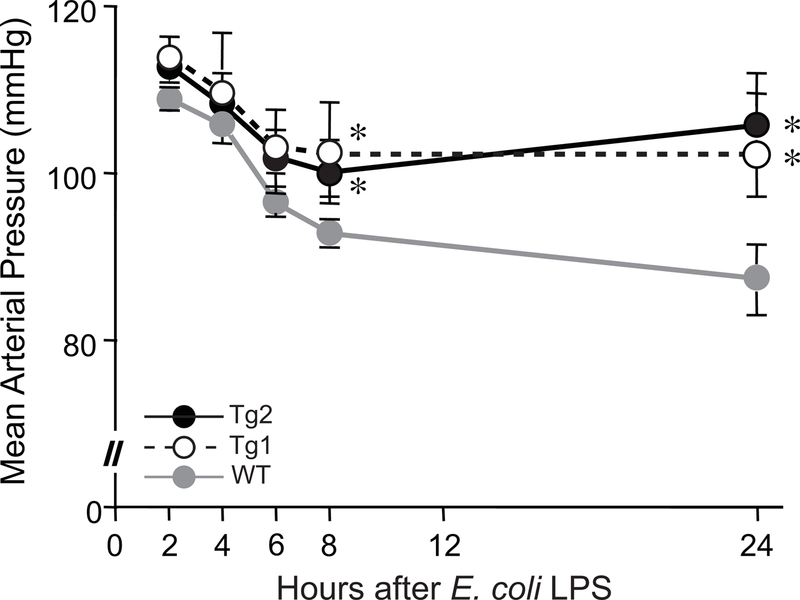
Figure 3. dnHMGA1 Tg mice have less severe hypotension when exposed to E. coli LPS.

Carotid artery catheters were implanted in WT (gray line), Tg1 (black dashed line), and Tg2 (black solid line) mice. The following day, the mice received E. coli LPS (10 mg/kg) IP. Mean arterial pressure (MAP) was measured at 2, 4, 6, 8, and 24 hours after injection of LPS. Data points represent mean MAPs ± SEM, for WT (n=10), Tg1 (n=8), and Tg2 (n=11) mice. Data was assessed by two-way ANOVA (P<0.0001). Significant comparison, * versus WT mice.
