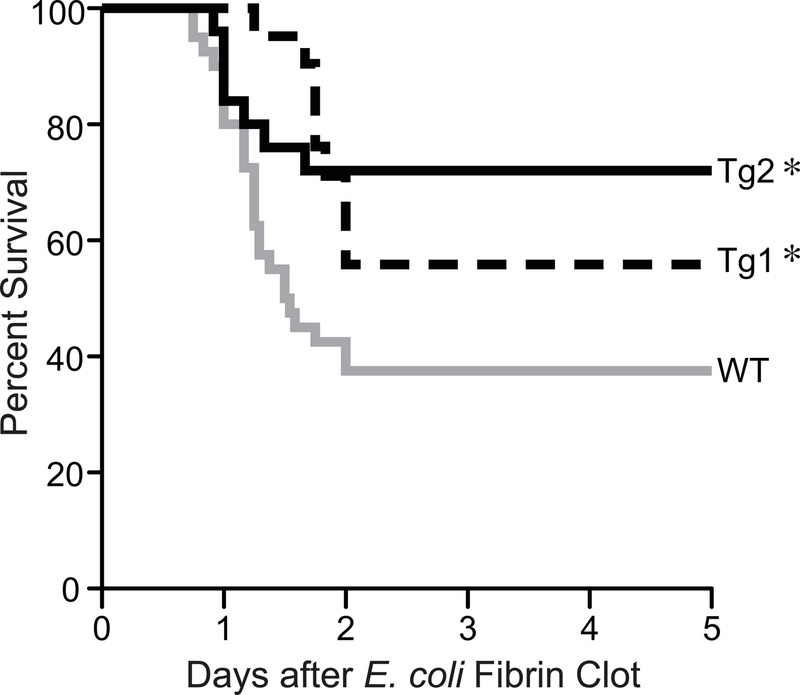
Figure 4. dnHMGA1 Tg mice have increased survival to E. coli-induced sepsis compared with WT mice.

WT (gray line, n=40), Tg1 (black dashed line, n=21) and Tg2 (black solid line, n=25) mice were subjected to fibrin clot-induced sepsis using E. coli (2.2 ± 0.2 × 10⁹ cfu/clot). Survival of mice was monitored for 5 days and data are presented as a Kaplan-Meier survival curve, and analyzed by Log-rank Test (P=0.0154). Significant comparison, ∗ versus WT group.
