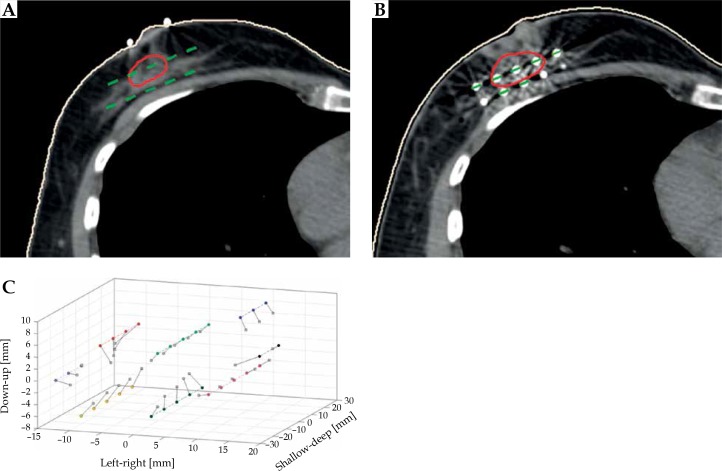
Fig. 1.
Simplified schematic of the plan reconstruction process. A) and (B) show an axial slice of the planning and post-implant CT, respectively. The CTV is contoured in red and the body in white. Seeds are indicated in green. C) shows the manual reconstruction (i.e., ground-truth match) for the same patient. Colored dots indicate the planning seed locations, with each needle shown in the same color and connected by dashed lines. Grey squares indicate post-implant seeds. Solid lines connect matched planned and post-implant seed locations. Planned and post-implant seed clouds have been registered using their centers-of-mass

