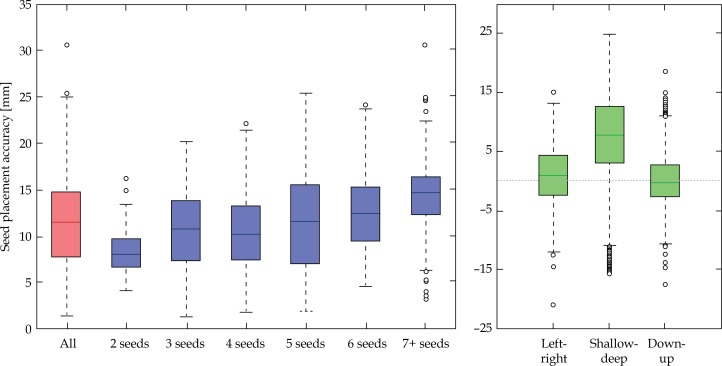
Fig. 3.
Seed placement accuracy for the 19-patient cohort (1235 seeds). Accuracy is shown for the entire seed population (red), grouped by number of seeds per needle (blue), and by direction in the needle co-ordinate system (green). Right, deep, and up are defined as positive directions. In this boxplot visualization, the central line denotes the median, the box extends over the interquartile range (IQR; 25th to 75th percentile), the whiskers extend to the most extreme data points excluding outliers, and the outliers (shown as circles) are defined as points > 1.5 × IQR above or below the 75th or 25th percentiles, respectively

