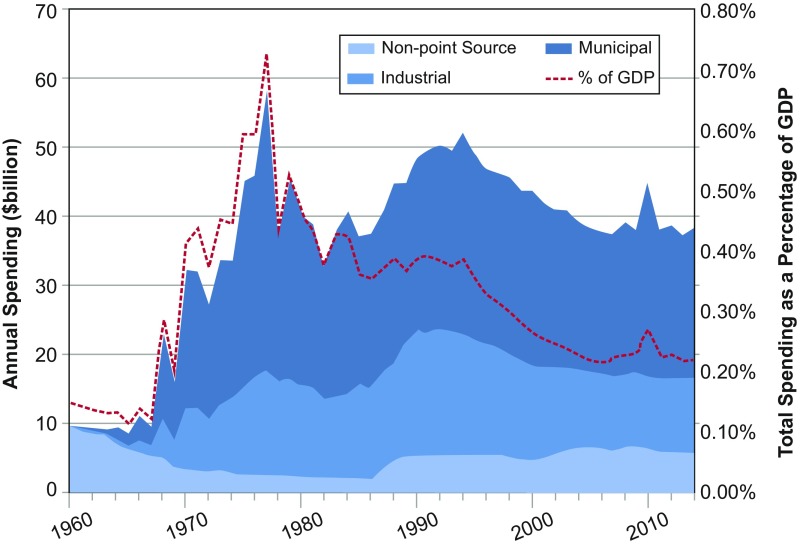
Fig. 1.
Spending on US water pollution control efforts, 1960–2014: CWA programs, industrial abatement, and USDA conservation spending. This figure displays annual spending on water pollution control efforts from 1960 to 2014. Estimates shown are in billions of dollars, deflated to 2014 using the Engineering News Record 2014 Construction Price Index. Estimates of municipal spending (dark blue) include state, federal, and local capital and operations and maintenance costs associated with CWA federal grants and federal and state-sponsored Clean Water State Revolving Funds. These municipal values exclude investments that occurred independently of the CWA, which were relatively more important before 1968. Industrial abatement costs (medium blue) are derived from annual Pollution Abatement Costs and Expenditure Survey from the US Census. Nonpoint source expenditures (light blue) include funds provided under section 319 of the CWA and technical and financial expenditures related to soil and water conservation programs sponsored by USDA. Total expenditures as a fraction of deflated GDP are shown as a dashed red line. See SI Appendix for more details.

