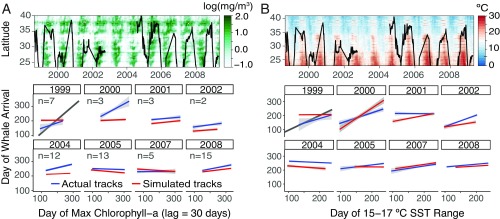
Fig. 2.
(Top) Annual blue whale latitudinal movements averaged over the population (black line) overlaid on Hovmoller plots of (A) chlorophyll-a and (B) SST. (Bottom) Annual linear regressions of whale movement phenology with contemporaneous (A) chlorophyll-a and (B) SST (observed tracks in blue; simulated tracks in red). Gray lines in the 1999 regressions indicate a 1:1 relationship.

