Fig. 2.
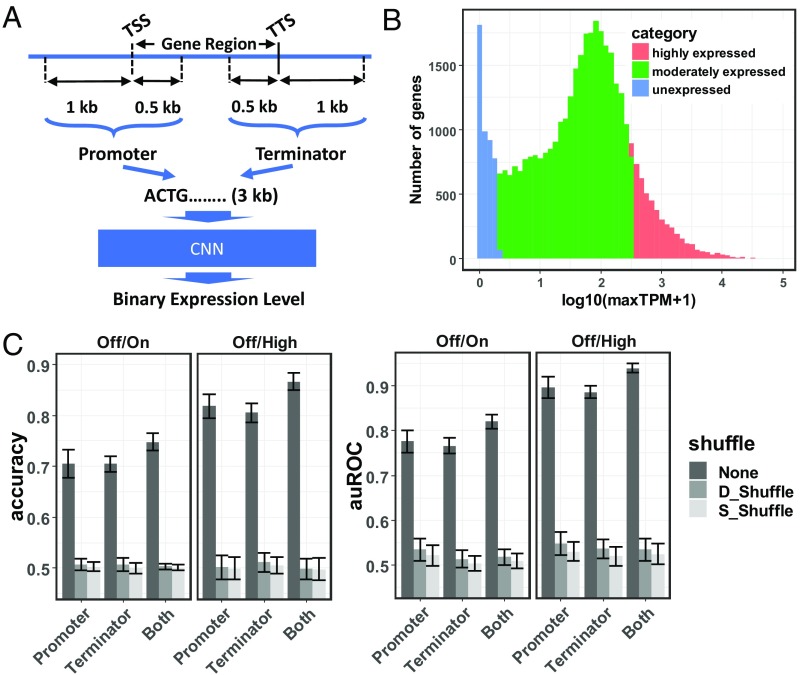
The architecture and performance of the pseudogene model. (A) A schematic representation of the architecture of the pseudogene model. The model takes promoter and/or terminator sequences as the predictor to predict binary expression levels. (B) A unified RNA-Seq data analysis pipeline is applied on 422 samples from seven references (9–15) representing a comprehensive collection of maize tissues at diverse developmental stages. The log-transformed maximum TPM over all samples is calculated for each gene and used to represent the strength of the corresponding predictor sequence. Shown is the distribution of log-transformed maximum TPMs for all maize genes. Genes are categorized into unexpressed genes (blue), moderately expressed genes (green), and highly expressed genes (red). (C) The accuracy and auROC of the pseudogene model trained on the Off/On gene set and the Off/High gene set, using promoters, terminators, or both promoter and terminator sequences as predictors. Models evaluated on test sets are either not shuffled (None) or shuffled while maintaining their di- or single-nucleotide composition (denoted as D_Shuffle and S_Shuffle, respectively). Error bars represent mean ± SD from gene-family–guided 10 times fivefold cross-validation.

