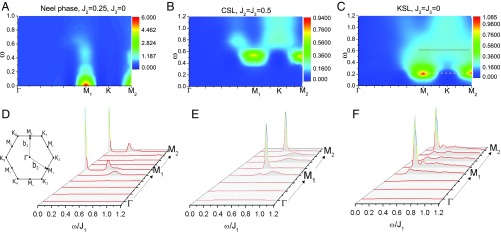
Fig. 2.
DSSF of different quantum phases on the KAFM. (A–C) Contour plots of the DSSF as a function of energy and momentum for (A) phase at ; (B) CSL at ; and (C) KSL at . The white (black) dashed line in C shows the constant-energy values at the low-frequency (high-frequency) region, which are compared with the INS observations in herbertsmithite (Fig. 4 has details). (D–F) The energy scans of the DSSF with the momentum along the path in the extended BZ. The intensity scales differ among the different panels. D, Inset shows the extended BZ with denoted high-symmetry momentum points and reciprocal vectors ().

