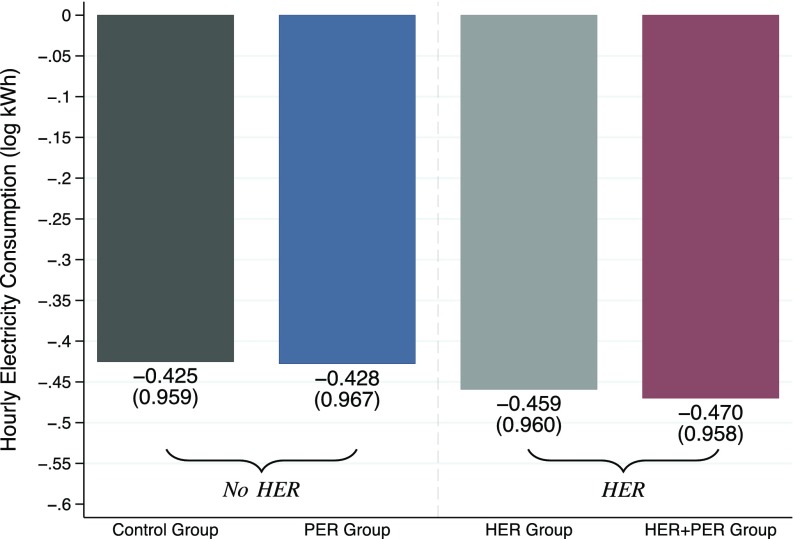
Fig. 5.
Treatment balance in log electricity consumption in the baseline period, from August 1–27, 2014, for the peak hours from 1300 to 1800 hours. Bar labels represent the averages, and we report corresponding SDs in parentheses. A more comprehensive set of summary statistics and balance tests is presented in SI Appendix, Table S1.

