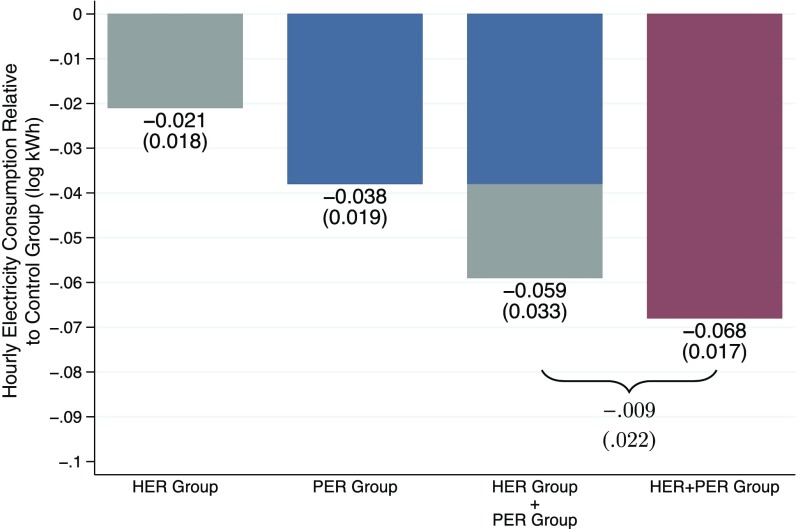
Fig. 7.
Average treatment effects during peak hours (1300–1800 hours) from a regression of log electricity use on treatment indicators and controls for each hour in the sample, the HER deployment wave, and the medium used to communicate the PER. We plot the total treatment effects on the 3 d with peak load events in the summer of 2014. Bar labels represent the point estimates, and we report corresponding SEs in parentheses. We also test the hypothesis of no crowd out by comparing the treatment effect of the HER+PER group and a summation of the treatment effects of the HER group and the PER group. We report the difference and corresponding SE.

