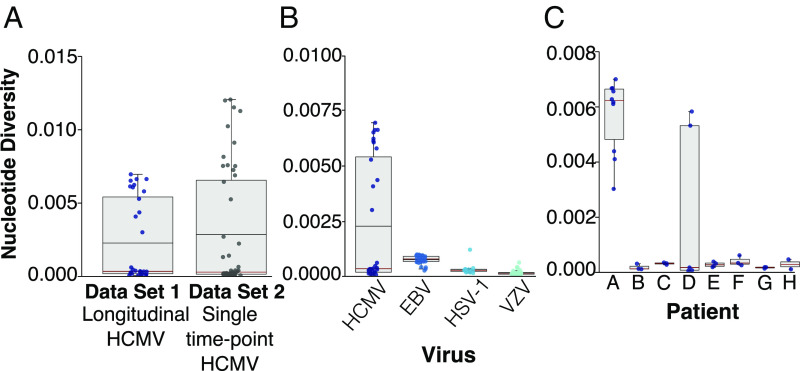
Fig. 1.
Box and whisker plot showing HCMV genome-wide within-host nucleotide diversity is dichotomous. (A) Genome-wide intrahost nucleotide diversity in longitudinal versus single time point HCMV samples. The circles represent individual samples. The mean values shown by the horizonal black line, and the median values shown by the red horizontal line. The box represents a 25–75% interquartile range. The maximum and minimum values are represented by vertical lines. (B) Comparison of HCMV diversity to other herpesviruses. (C) Nucleotide diversity within eight individual patients that make up the HCMV longitudinal dataset 1.

