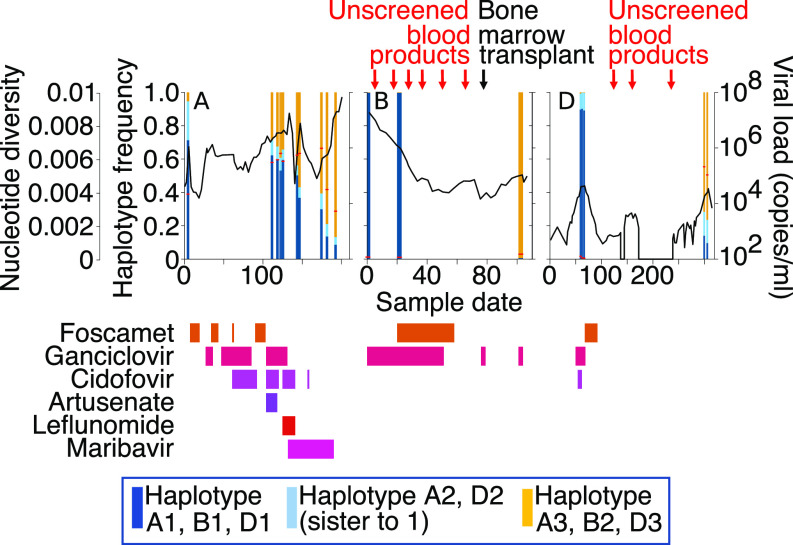
Fig. 3.
Haplotype abundances over time for patients A, B, and D with mixed (paraphyletic) infections. Haplotype frequencies in each sample are shown. The dark and light blue haplotypes are sister taxa, whereas the yellow haplotypes are paraphyletic in Fig. 2. The viral load is represented by the black line, and sample diversity is represented by a horizonal red bar. Antiviral drugs prescribed and their timings are shown in shades of pink and red. The timing of HSCT and blood products administered to patients B and D are shown.

