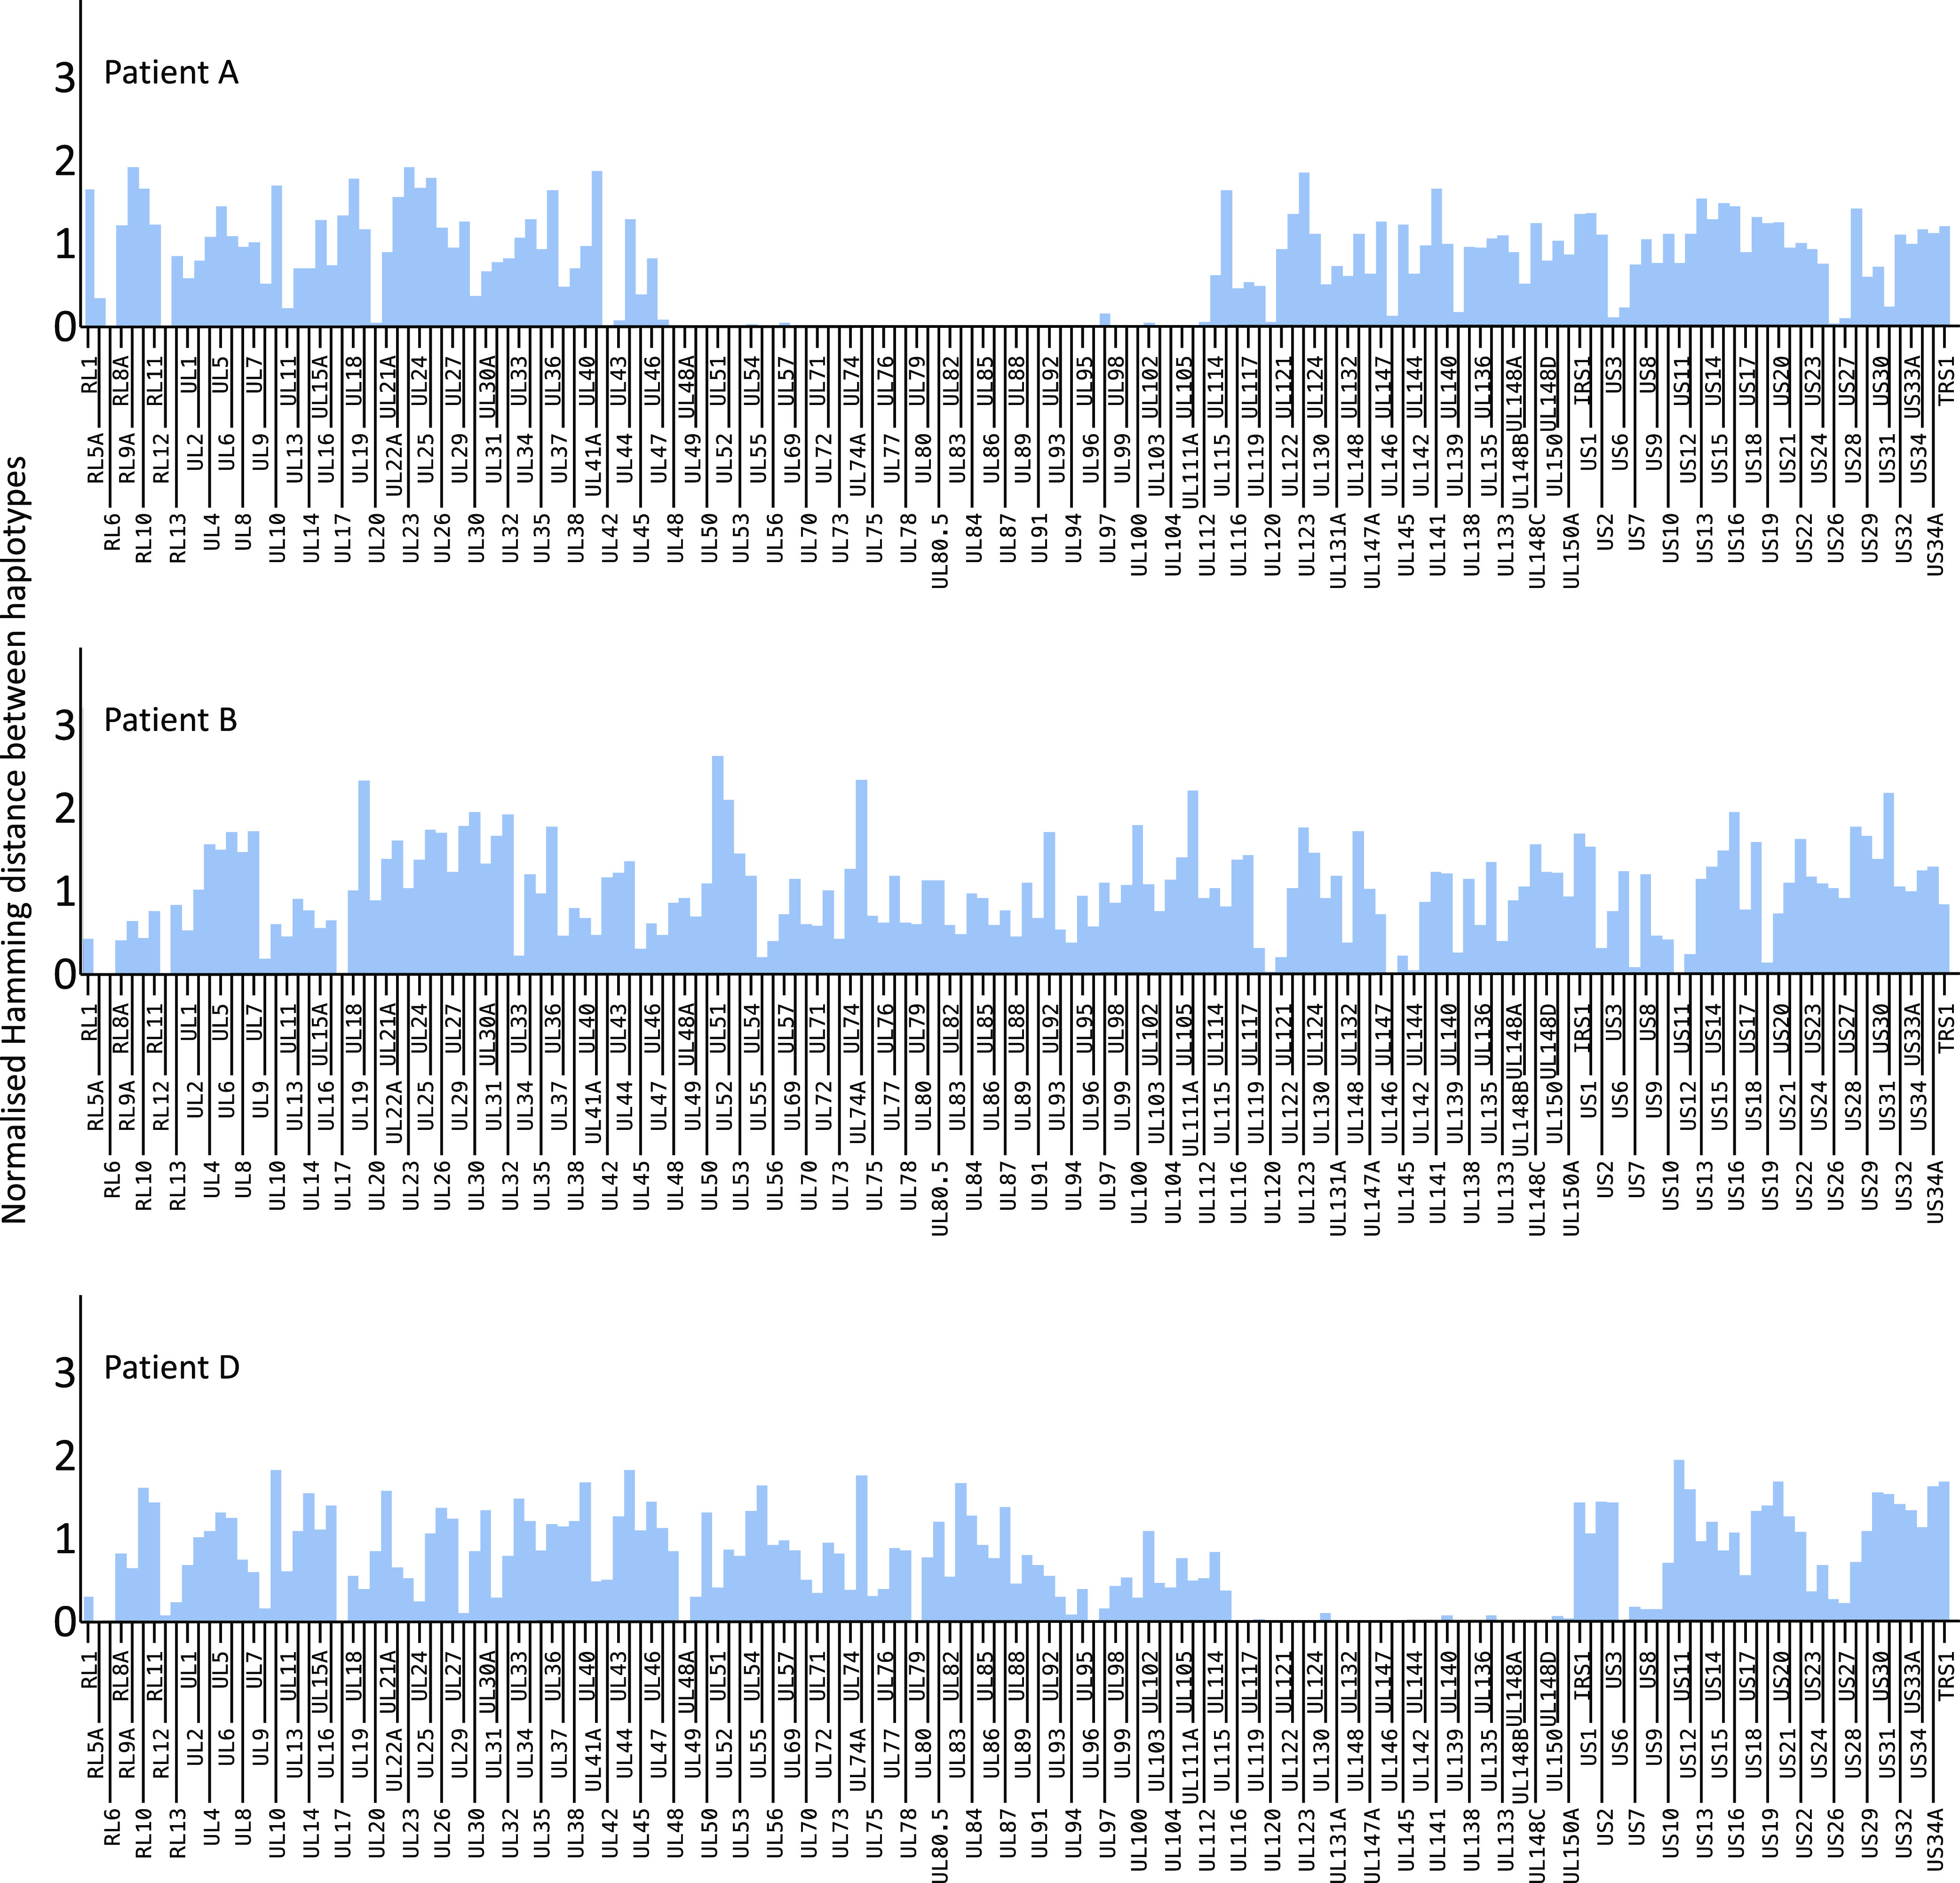
Fig. 4.

Genome-wide pairwise genetic distance among paraphyletic haplotypes in patients A, B, and D. The blue bars represent genetic distance among ORFs for paraphyletic haplotypes A1 and A3, B1 and B2, and D1 and D3, normalized for average pairwise distance between unrelated GenBank HCMV sequences (red line).
