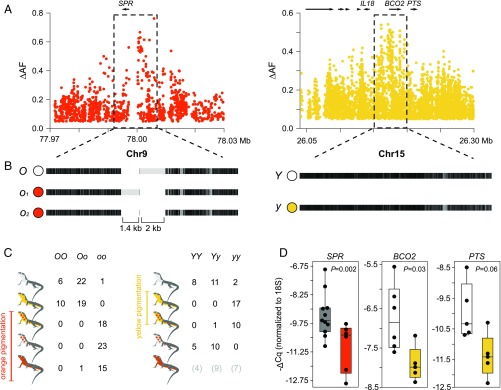
Fig. 3.
Regulatory variation explains color polymorphism in the common wall lizard. (A) Differences in allele frequencies (ΔAF) for the orange and yellow phenotypes around SPR and BCO2 (each dot represents an SNP). (B) Haplotype structure for the same two regions based on the alignment of our reference genome sequence to consensus sequences of the alternative haplotypes obtained using Nanopore and Sanger sequencing. Black indicates homology, and light gray indicates mismatches that can originate from point mutations or indel variants. (C) Individual genotypes for the SPR and BCO2 loci among the five morphs based on high ΔAF variants selected from the whole-genome data. (D) qPCR measurements of SPR, BCO2, and PTS expression in ventral skin.

