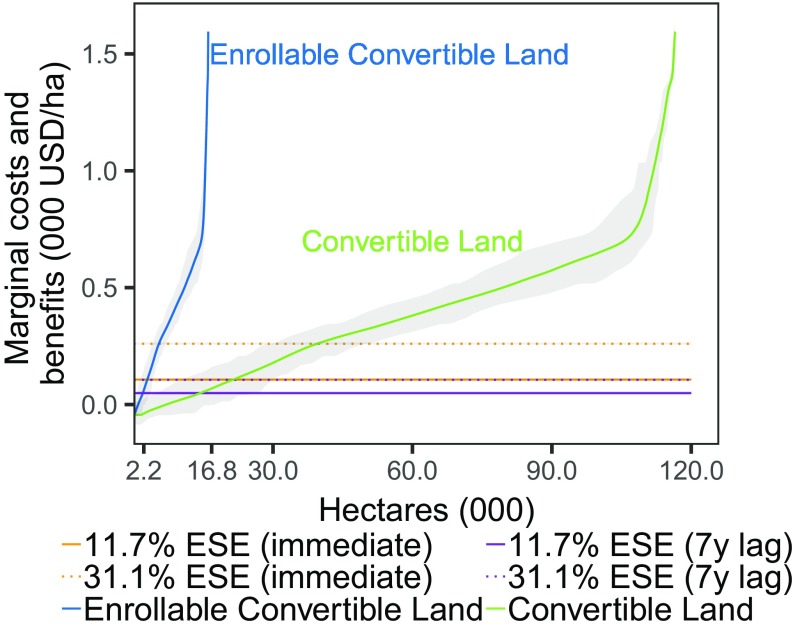
Fig. 2.
Marginal cost for convertible land (physical extent of the market) and enrollable convertible land (social and physical extent of the market) with 95% confidence intervals, and marginal revenue under an average 11.7% ESE and an average 31.1% ESE (dashed and dotted lines, respectively) for the entire PCW. Marginal revenues are shown assuming an ESE is realized immediately (orange) and after a 7-y lag (purple).

