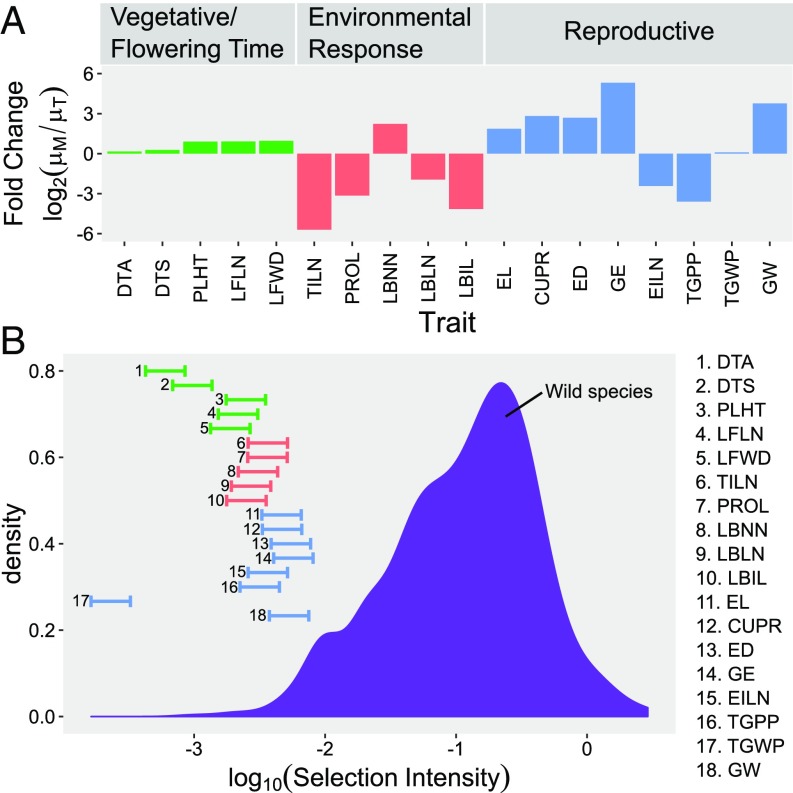
Fig. 3.
Changes in trait means and selection intensities. In A, changes in trait mean are measured as or fold change of maize landrace outcross mean over teosinte outcross mean . In B, absolute selection intensities for 741 traits in wild species under natural selection are shown in a density plot [data from Kingsolver et al. (54)] and for 18 traits in maize under domestication are shown in horizontal bars. Left end of the bars represents selection intensities estimated from 9,000 generations of selection, and right end represents selection intensities estimated from 4,500 generations of selection.

