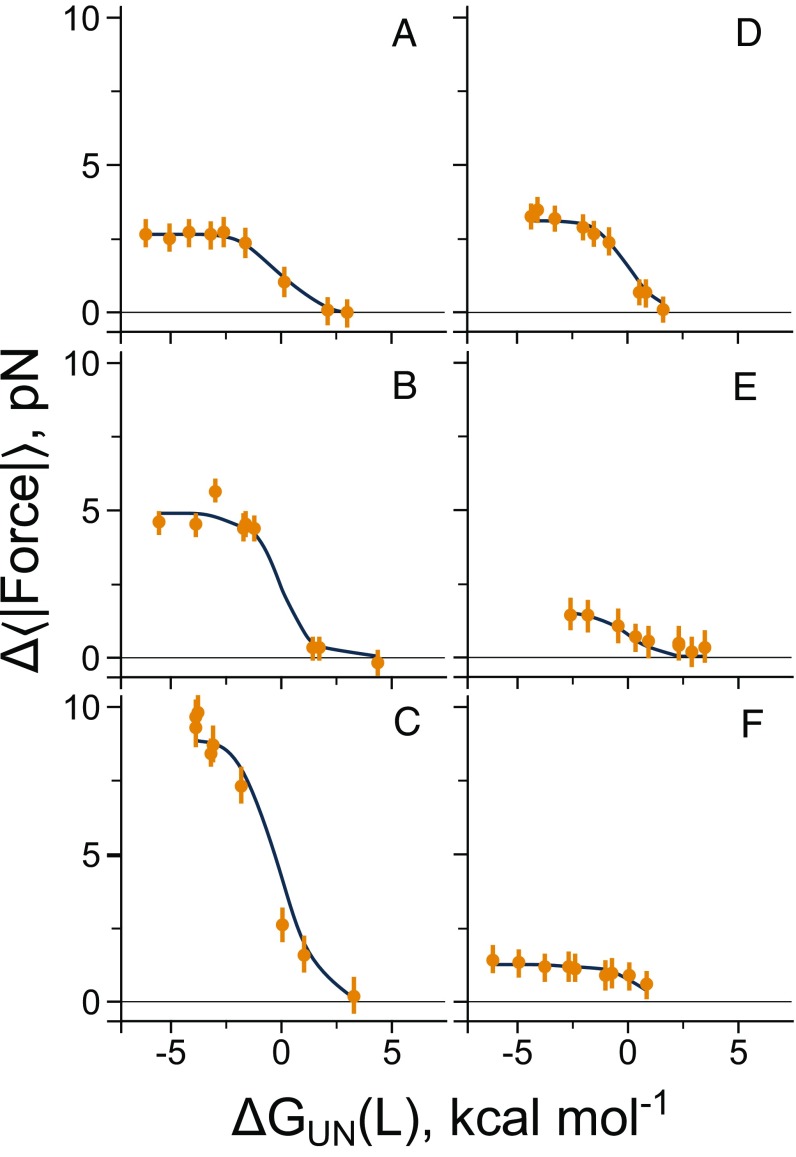
Fig. 4.
A statistical mechanical model describes how the pulling force changes with native-state stability at a fixed linker length. Pulling force (Eq. 6) versus native state stability for each of the five domains is plotted at a fixed linker length. Proteins (A) 1F0Z, (B) 2IST, (C) 1P9K, (D) 2JSO, (E) 1NY8, and (F) 1NY8 at linker lengths of 23, 25, 25, 22, 16, and 25 residues, respectively. Results from the arrested-ribosome simulations are shown as circles, whereas the fit to the statistical mechanical model (Eq. 1) is shown as a solid line. Error bars represent 95% confidence intervals about the mean calculated from block averaging.

