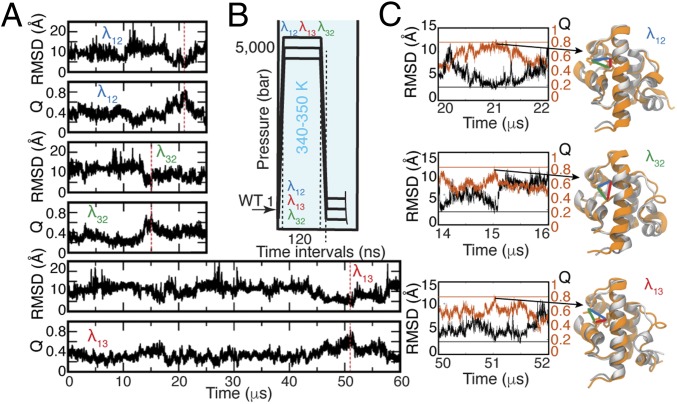
Fig. 1.
MD simulations of the three λ6–85 multiprobe mutants. (A) Time trajectories of Q and rmsd based on α-carbon atoms of the λ6–85 crystallographic state [PDB ID code 3KZ3 (33)]. Red dashed vertical lines indicate the time points when the proteins visited the folded state. (B) Simulation protocol (details are provided in SI Appendix, section 2 and Table S1). The unfolded WT from our previous study (18) was mutated and simulated at 5,000 bar and 340 or 350 K before jumping the pressure down to 1 bar. (C) Close-up view of time dynamics of Q (orange) and rmsd (black) near the folded states. Horizontal lines correspond to Qmax = 0.8 (orange) and rmsd = 2.5 Å (black). The crystallographic state (gray) overlapped with the simulated structures of each mutant at the time when these mutants visited the folded state with Qmax = ∼0.8 (21.0 μs for λ12, 15.0 μs for λ32, and 51.5 μs for λ13). Distances between residues used in fluorescence measurements are shown with colored lines (contact 1–2 in blue, contact 3–2 in green, and contact 1–3 in red).

