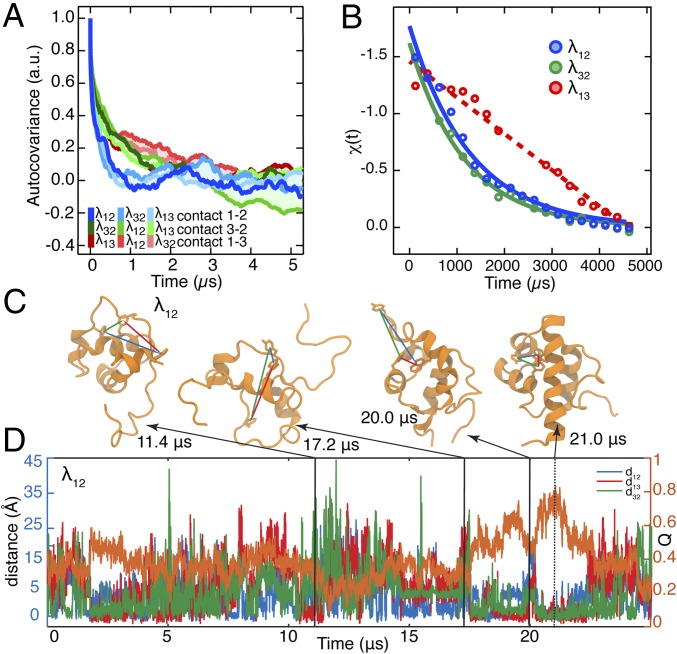
Fig. 2.
Dynamics of λ6–85 captured by three fluorescent contact pairs. (A) Autocovariance analysis of the MD time trajectories of distances between residues used as contact probes in . In each simulation, the three residue–residue distances were extracted regardless of whether the mutants had the fluorescent probes in those positions or not. Autocovariance analysis was performed on the resulting time trajectories and shows fast exploration of contacts before folding. (B) Experimental fluorescence lifetime relaxation traces collected following a P-jump of ms, ms, and λ13. The time constant could not be extracted for the slow λ13 decay [linear fit (dashed line) is shown instead]. All P-jump time traces are normalized from 0 to 1. (C) Representative protein structures with at least one folded-like distance for λ12. Interresidue distances are shown with lines color-coded by the contact pair (λ12, blue; λ32, green; λ13, red). The simulation time points when these structures were observed are indicated. (D) Time trajectories of the λ12 fraction of native contacts (Right axis; orange trace) and distances between the side chains of residues located at the positions used for fluorescent probes (Left axis; blue, green, and red traces).

