Fig. 3.
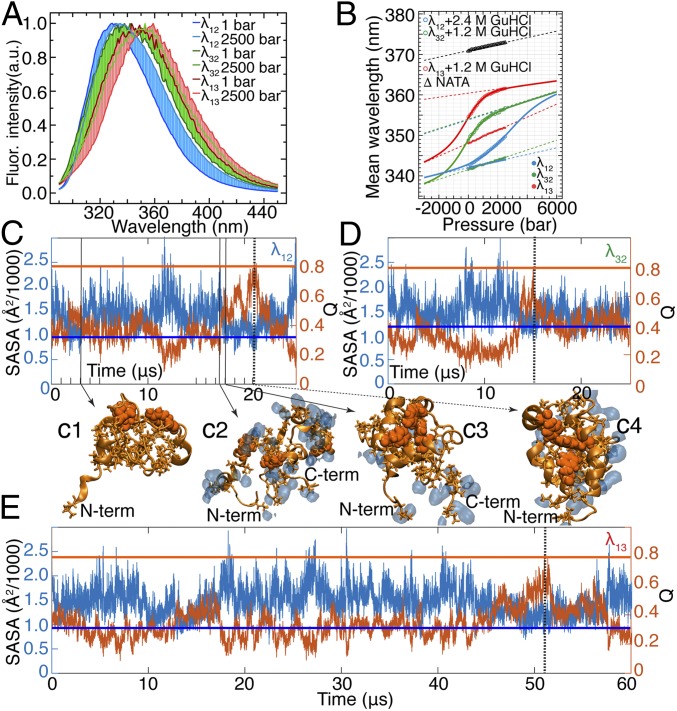
Water-coupled dynamics in the hydrophobic core of λ6–85. (A) Fluorescence (Fluor.) spectra of λ6–85 mutants at 1 bar and 2,500 bar (the full datasets are provided in SI Appendix, Fig. S21). The point of maximal intensity is normalized to unity to highlight the pressure-induced spectral shift. λ12 is in 2.4 M GuHCl; λ13 and λ32 are in 1.2 M GuHCl. (B) Change of mean wavelength of the spectra in A as a function of pressure. Connected solid circles are the data collected for each mutant in the absence of GuHCl. Connected open circles represent the data collected at 2.4 M GuHCl for λ12 and 1.2 M GuHCl for λ13 and λ32. The data for NATA are also shown (△). Solid lines are two-state thermodynamic fits, and dashed lines are the corresponding baselines of folded and unfolded states (the detailed fitting procedure is described in SI Appendix, section 7). (C–E) SASA of hydrophobic side chains of λ6–85 mutants is anticorrelated with Q. Horizontal lines mark SASA (blue) and Q (orange) values in the folded state of each protein mutant. SASA values are 984 Å2 for λ12, 1,180 Å2 for λ32, and 908 Å2 for λ13. Vertical dashed lines (black) mark time points when each protein visited the folded-like conformation (21.0 μs for λ12, 15.0 μs for λ32, and 51.5 μs for λ13). Representative structures of λ12 (tryptophan/tyrosine contact pairs are shown as orange van der Waals spheres, hydrophobic side chains are shown as orange sticks) demonstrate that expulsion of water (shown as blue shapes within 2.5 Å from hydrophobic side chains) from the protein core can form a nonnative overpacked (low Q and SASA below folded value) conformation (C1), while the protein core can be hydrated (C2) en route to the native conformation (C3 and C4). C-term, C terminus; N-term, N terminus.

