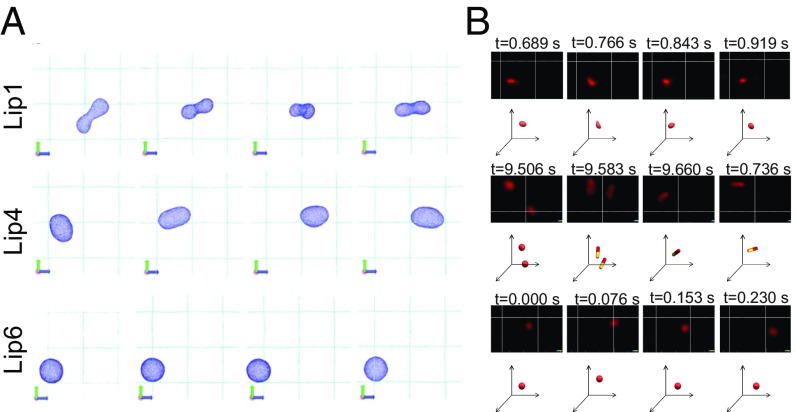
Fig. 7.
(A) Representative snapshots of liposomal structures from the simulation at T* = 0.21ε. (B) Snapshots and trajectory analysis of liposomal formulations in mucus as imaged by STED. A volume of 5 μL of DiI-labeled liposomes (Lip1, Lip4, and Lip6) was added to 200 μL of mucus. The images of liposomes (red) were acquired using 530-nm excitation and 565-nm emission for 10 s. Corresponding 3D schematic drawings of the position and deformation of the liposomes in panel (xyz-axis) are drawn below the STED images.

