Fig. 1.
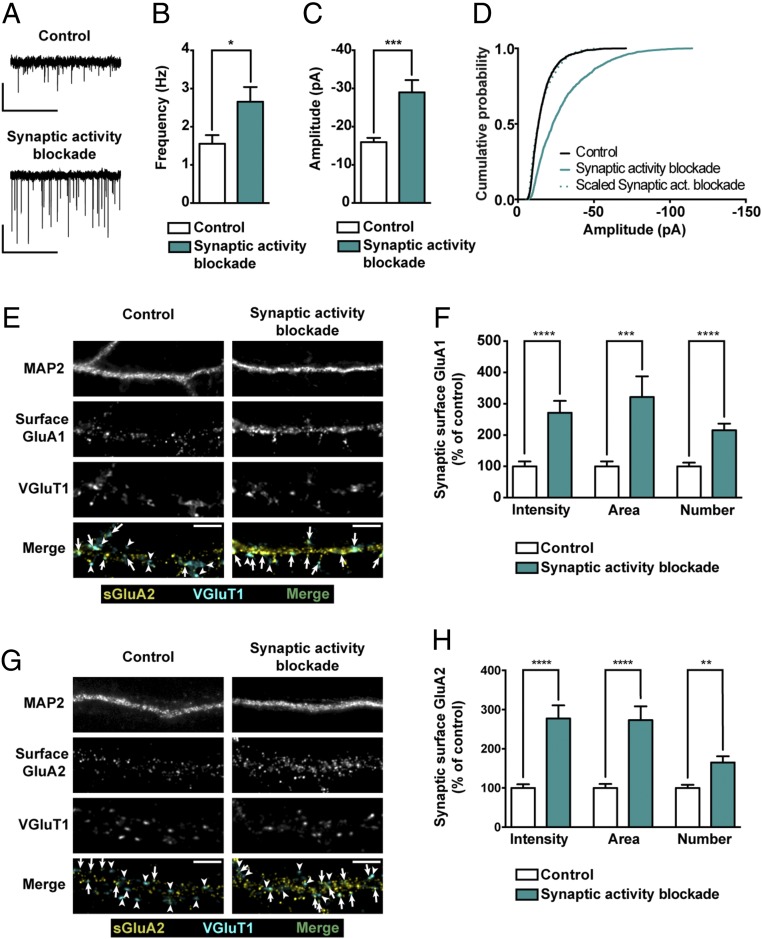
Chronic activity blockade of AMPARs and NMDARs upscales AMPARs in hippocampal neurons. (A) Representative whole-cell current traces of AMPAR-mediated mEPSCs from hippocampal neurons in control conditions or treated with 50 μM GYKI-52466 and 10 μM MK-801 for 24 h. (Scale bars: vertical, 20 pA; horizontal, 5 s.) Mean frequency (B) and amplitude (C) of AMPAR-mediated mEPSCs upon chronic synaptic activity blockade (n = 11–13 neurons per condition, three independent preparations; Mann–Whitney test: *P ≤ 0.05, ***P ≤ 0.001). (D) Cumulative probability histograms of mEPSC amplitude. The cumulative probability curve of “synaptic activity blockade” amplitude was scaled by dividing by a factor of 2.22 (n = 1,650–1,950 events recorded from 11 to 13 cells per condition, three independent preparations). (E and G) Representative images of hippocampal neurons in control conditions or treated with GYKI-52466 and MK-801 for 24 h and stained for surface GluA1 (E) or surface GluA2 (G), VGluT1 and MAP2. Arrows indicate colocalization of surface staining (yellow) and VGluT1 puncta (cyan); arrowheads pinpoint VGluT1 puncta (cyan) that do not colocalize with GluA clusters. (Scale bars, 5 μm.) (F and H) Intensity, area and number of synaptic GluA1 (F) or GluA2 (G) clusters (colocalizing with VGluT1 clusters) per dendritic length (n = 29–33 neurons, three independent experiments; Mann–Whitney test: **P ≤ 0.01, ***P ≤ 0.001, ****P ≤ 0.0001).

