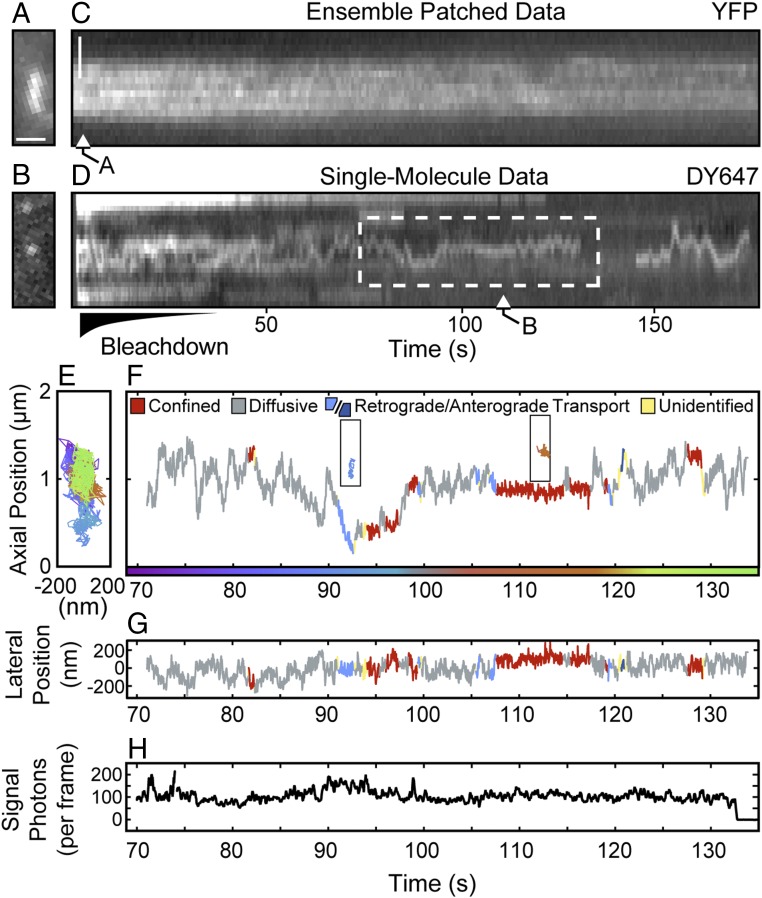
Fig. 2.
Characterization of PTCH1 motional dynamics in cilia. Representative kymograms and trajectories of PTCH1-ACP-YFP in cilia show three modes of motion: diffusion, confinement, and directional transport. Using two-color imaging, we observe the movement of both the bulk populations of PTCH1 molecules (YFP, in A and C) and single-molecule trajectories (DY647, in B and D). (A) Fluorescent image of YFP in the cilium. Cilia were identified based on the accumulation of YFP. (B) Image of an isolated DY647-labeled PTCH1-ACP-YFP molecule in the cilium shown in A. (C) Kymogram of the YFP channel for the cilium shown in A. (D) Kymogram of the red imaging channel of the same region shown in C. (E) Two-dimensional single-particle trajectory extracted from the period marked with a dashed line in D, color coded for time. (F and G) The same trajectory shown as the long axis (F) or short axis (G) position in time, color coded for the classified movement type. Boxed Insets show the 2D trajectory during an identified period of retrograde transport and confinement, respectively. (H) The signal photons maintain steady levels indicative of a single fluorophore followed by a single-photobleaching event. For clarity, the trace shows the average number of photons from a three-frame window. (Scale bar: 1 μm.)

