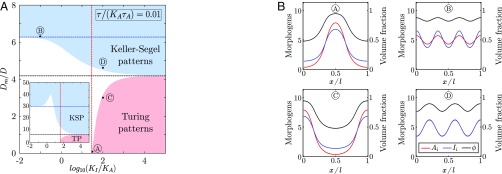
Fig. 2.
Linear stability analysis and numerical simulations of pattern formation in active biphasic tissues. (A) Phase diagram of Eq. 5 in the parameter space for and (Inset). The red and blue dashed lines correspond to analytical thresholds of instability (given in the text) for Turing and Keller–Segel patterns, respectively. The black dashed line is the analytical phase boundary between both regimes in the limit given by . This limit is shifted up when the ratio is increased, while a pronounced notch appears in the “Keller–Segel patterns” domain (Inset). Other parameters are set to , , , , , and large tissue size (). (B) One-dimensional numerical simulations of Eq. 5 with random initial conditions for several choices of parameters identified by letters A, B, C, and D. .

