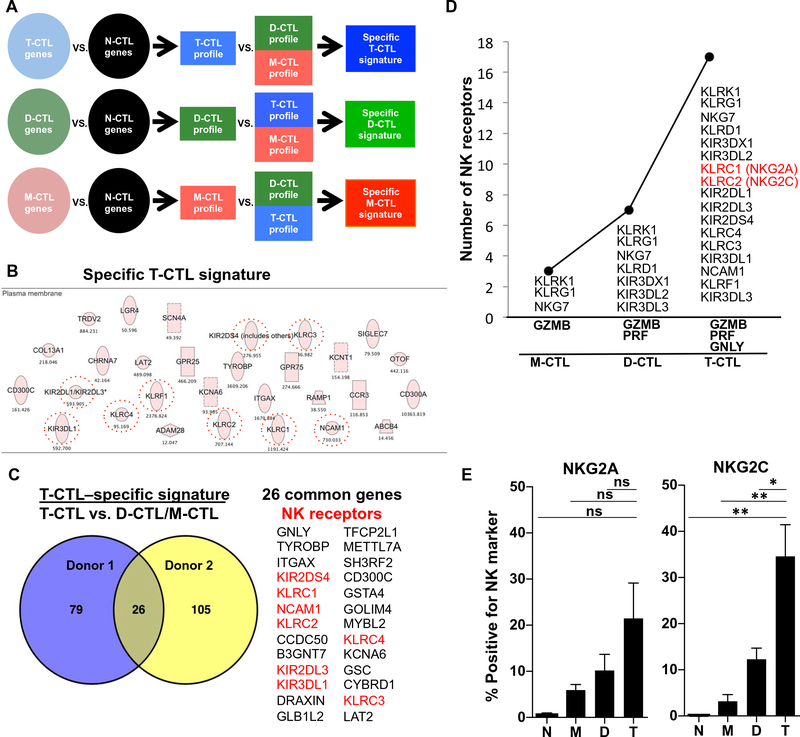
Fig. 3. RNA-seq of cytotoxic cell populations identifies a specific T-CTL gene signature composed of NK receptors that correlate with the number of cytotoxic molecules expressed and that are enriched on T-CTLs.
(A) RNA-seq was performed on sorted populations of T-CTL, D-CTL, M-CTL, and N-CTL cells. Gene profiles of T-CTL, D-CTL, and M-CTL cells were created by selecting genes increased twofold or more in each population over the N-CTL population. Specific gene signatures were then created by selecting genes more highly expressed in one profile when compared with the others. (B) Genes comprising the T-CTL specific signature were analyzed by Ingenuity (Qiagen) and sorted for surface expression. NK receptors are circled. (C) The “specific T-CTL signatures” between two donors were overlapped using VENNY (69), and common genes are listed, with NK receptors highlighted in red. (D) The number of surface NK receptors expressed in a population (y axis) is graphed as a function of the number of cytotoxic molecules expressed by that population (x axis). NK receptor expression by a population is defined by greater than twofold expression over each preceding population (or 1.5-fold for T-CTLs versus D-CTLs). (E) CTL subsets from 10 donors were analyzed for the denoted NK marker expression by flow cytometry. The average percentage of T-CTL, D-CTL, M-CTL, and N-CTL cells expressing these markers in each respective donor is shown. *P < 0.05, **P < 0.01.

