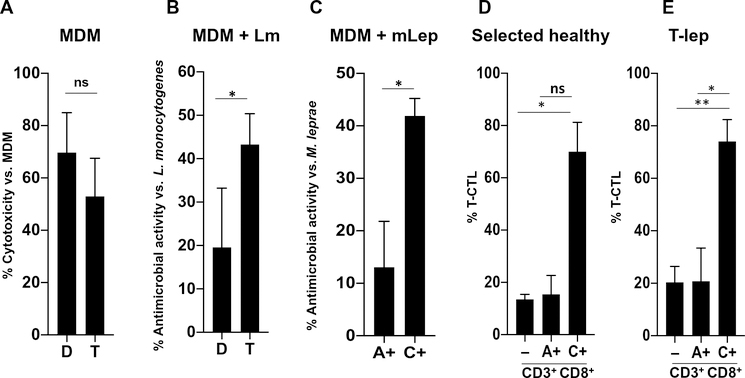
Fig. 5. T-CTLs can be purified using NK receptors and display greater antimicrobial activity as compared with other CD8+ T cells.
(A) MDMs coated with anti-CD3 were admixed with the T-CTL and D-CTL clones in an E:T ratio of 2:1, as indicated. LDH was measured in culture supernatants after 4.5 hours. The percent cytotoxicity was calculated by comparing the amount of LDH released in each condition to the amount of LDH released by MDMs alone (n = 4). (B) L. monocytogenes (Lm)–infected MDMs coated with anti-CD3 were admixed with the T-CTL and D-CTL clones at an E:T ratio of 2:1, as indicated. After 20 hours, MDMs were lysed and the amount of L. monocytogenes present was assessed by CFU. Percent antimicrobial activity was determined by normalizing the amount of bacterial growth in each condition to the amount of bacterial growth found in infected MDMs without admixed T cells (n = 4). (C) M. leprae (mLep)–infected MDMs coated with anti-CD3 were admixed with sorted populations of CD8+ T cells based on NKG2A and NKG2C expression in an E:T ratio of 2:1, as indicated. The T-CTL, D-CTL, M-CTL, and N-CTL composition of each sorted population was delineated at the time of sorting. After 24 hours, RNA and DNA were isolated and the ratio of bacterial RNA to DNA was calculated. Antimicrobial activity was determined by normalization of each condition to M. leprae–infected MDMs admixed with NKG2A− and NKG2C− cells (n = 4). (D) The percent of T-CTLs in total CD3+CD8+ (−), CD3+CD8+NKG2A+ (A+), and CD3+CD8+NKG2C+ (C+) cells was determined in four healthy donors by flow cytometry and is compared. (E) The percent of T-CTLs in total CD3+CD8+ (−), CD3+CD8+NKG2A+, and CD3+CD8+NKG2C+ cells was determined in T-lep donors by flow cytometry and is compared (n = 4). *P < 0.05, **P < 0.01.

