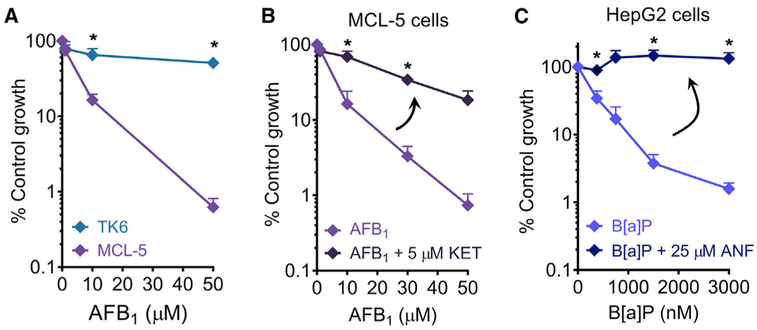
Figure 6. Application of μCC to Study Toxicity Induced by Metabolic Activation in Metabolically Competent Cell Lines.
(A) AFB1 exposure for TK6 and MCL-5. *p < 0.05, Student’s t test, two-tailed, unequal variance.
(B) Treatment of MCL-5 cells with AFB1 alone or in the presence of 5 μM KET.
(C) Treatment of HepG2 cells with B[a]P alone or in the presence of 25 μM ANF.
In (B) and (C), *p < 0.05, Student’s t test, two-tailed, paired. n ≥ 3. Error bars are SEM.

