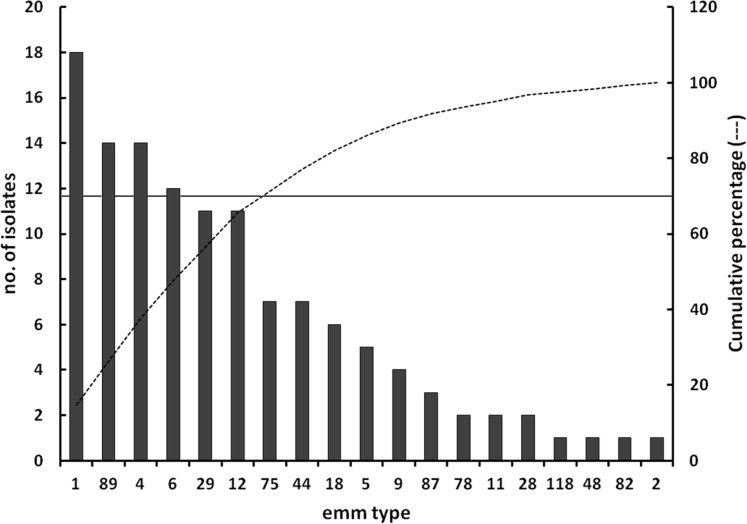
Figure 1. Distribution of emm types.
Distribution of emm types within the Streptococcus pyogenes population under investigation. The principal Y-axis reports the absolute number of isolates distributing into each emm type group, while the secondary Y-axis refers to the cumulative function (dotted line) computed from the distribution of emm types sorted in a descending order of isolates relative abundance. The continuous horizontal line, referring to the secondary Y-axis, indicates the 70% of the study population.

