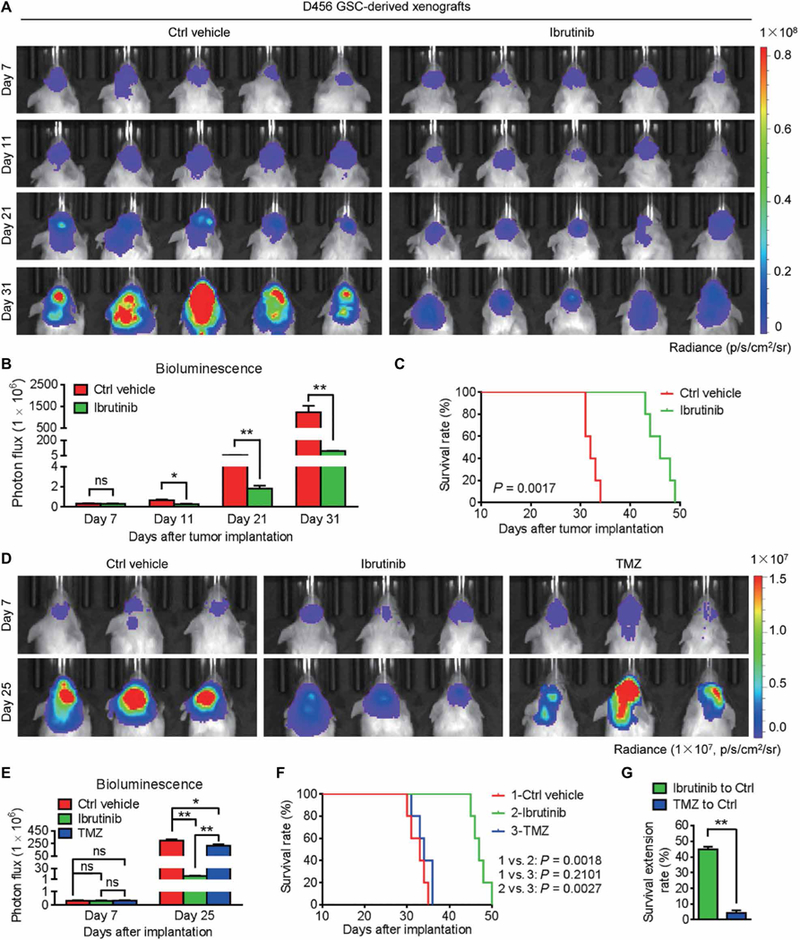
Fig. 1. Ibrutinib is more effective than TMZ at inhibiting GSC-derived tumor growth to extend animal survival.

(A and B) In vivo bioluminescent images (A) and the quantification (B) of human GSC-derived xenografts in the brains of mice treated with ibrutinib or the vehicle control at the indicated time points. (C) Kaplan-Meier survival analysis of mice bearing GSC-derived xenografts treated with ibrutinib or the vehicle control. (D and E) In vivo bioluminescent images (D) and the quantification (E) of GSC-derived xenografts in mice treated with ibrutinib or TMZ at the indicated time points. (F) Kaplan-Meier survival analysis of mice bearing GSC-derived xenografts treated with the vehicle control, ibrutinib, or TMZ. (G) Survival extension of mice bearing GSC-derived GBM tumors treated with ibrutinib or TMZ relative to those treated with the vehicle control. Statistical analysis was performed using unpaired Student’s t test for two-group comparison, one-way analysis of variance (ANOVA) for multigroup comparison, or Kaplan-Meier method for survival analyses. Data are means ± SEM (B and E) or means ± SD (G). ns, not significant. *P < 0.05 and **P < 0.01. n = 5 for each group. p, photons; sr, steradian.
