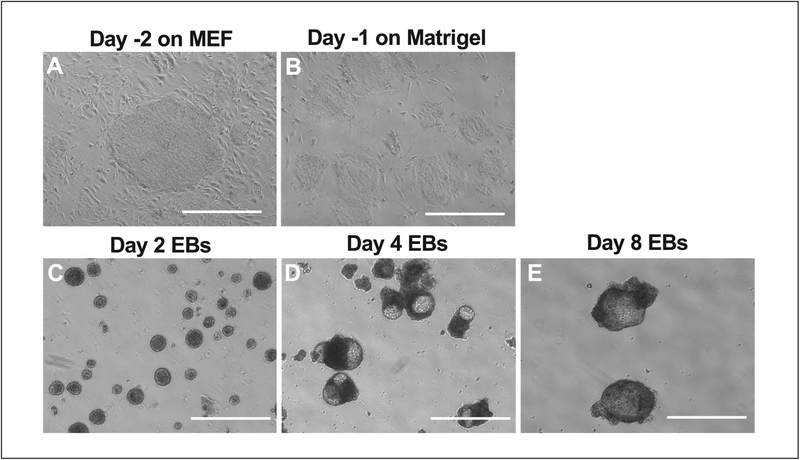
Figure 2.
The morphology of iPSCs and EBs from day −2 to day 8 of the differentiation. (A) The optimal size of iPSC colonies prior to MEF depletion at day −2. (B) The size of iPSC colonies on Matrigel-coated plates after MEF depletion at day −1. (C) The day 2 EBs. (D) The day 4 EBs. (E) The day 8 EBs. Note that the size of EBs increases during the course of differentiation. The white bar = 100 μm.

