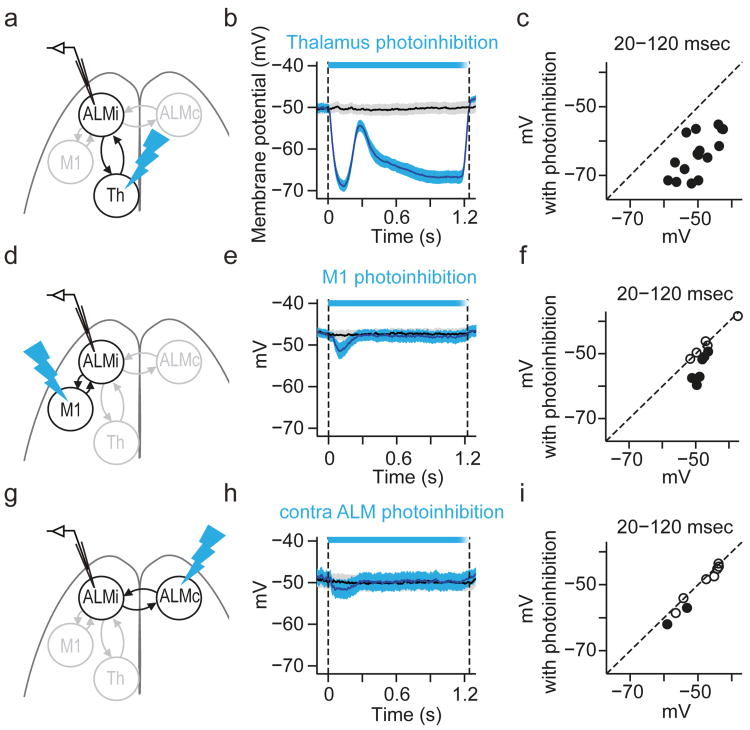
Figure 4. Comparison of thalamic and cortical input.
a. Whole-cell recording in ALM during thalamus photoinhibition (panels b-c).
b. Time-course of mean membrane potential in ALM neurons during thalamus photoinhibition (n = 16 cells). Shading, SEM. Panels e and h follow the same format. Two hundred milliseconds after photostimulation onset, the membrane potential transiently recovered, likely caused by a concomitant rebound in thalALM activity (Extended Data Fig. 2).
c. Mean membrane potential during 20-120 ms after photostimulus onset. Filled circles, neurons that were significantly modulated by photoinhibition (P < 0.05, t-test). Dotted line, the unity line. Panels f and i follow the same format.
d-g. Whole-cell recording in ALM during M1 photoinhibition (n = 11 cells).
g-i. Whole-cell recording in ALM during contralateral ALM photoinhibition (n = 9 cells).

