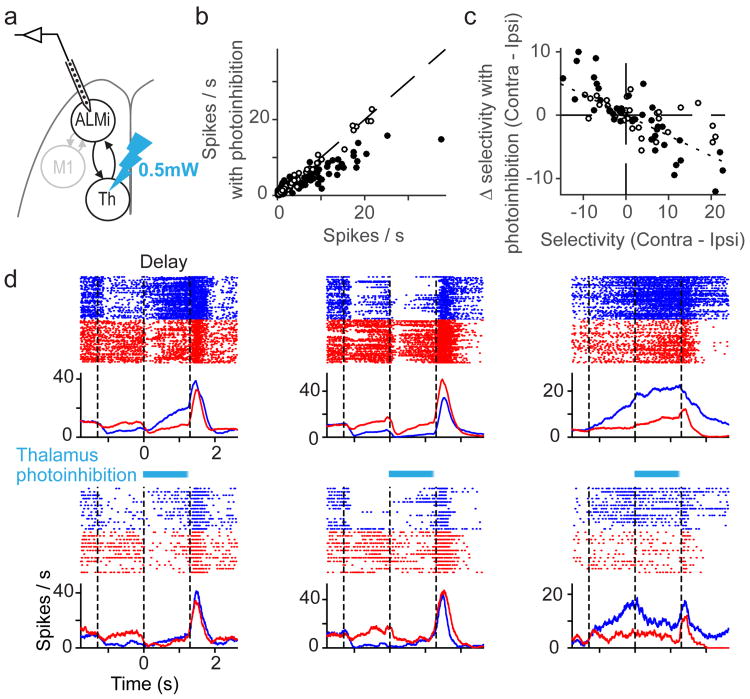
Figure 5. Thalamic activity maintains selectivity in ALM.
a. Recording in ALM during weak thalamic photoinhibition (panels b-d).
b. Spike rates were measured for 1300 ms during photoinhibition and control conditions. Filled circles, neurons that were significantly modulated by thalamus photoinhibition (P < 0.05, t-test, n = 160).
c. Relationship between selectivity of individual neurons and changes in selectivity due to photoinhibition of thalamus. Dotted line, linear regression (slope = -0.33, Pearson correlation coefficient = -0.75). Filled circles, the same as in b.
d. Three example neurons. Same format as Fig. 2b.

